Getting started with UDB
UDB is Undo’s time travel debugger. It records the execution history of a program, so that the program can be executed forward and backward and its state examined at any time in its history. This makes it possible to diagnose the cause of defects by executing backwards from incorrect results to the code that created the results.
UDB can also load recordings of your software created by LiveRecorder.
Try the online tutorial: Getting started with UDB.
Launching a program in UDB
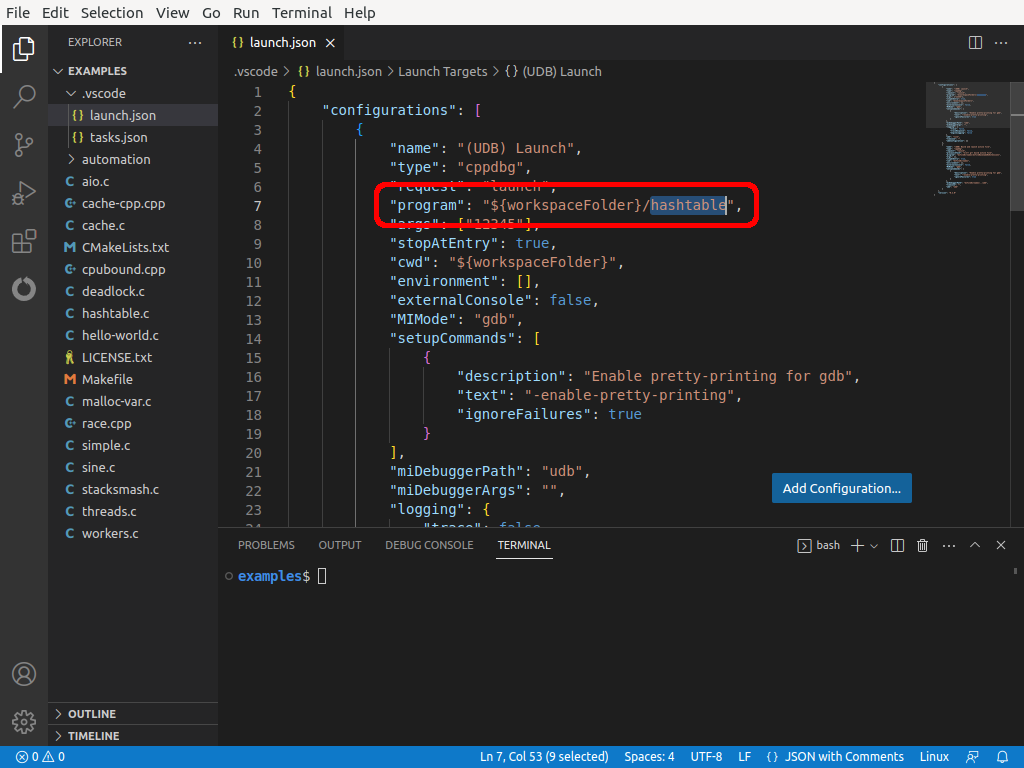
Start udb, naming the program to be debugged on the command line:
$ udb examples/hashtable
Reading symbols from examples/hashtable...
Then use the run command in UDB to run the program with command-line arguments:
not running> run 12345
Starting program: examples/hashtable 12345
hashtable: hashtable.c:131: main: Assertion `table_contains(table, element)' failed.

Program received signal SIGABRT, Aborted.
__pthread_kill_implementation (no_tid=0, signo=6, threadid=<optimized out>)
    at ./nptl/pthread_kill.c:44
44            return INTERNAL_SYSCALL_ERROR_P (ret) ? INTERNAL_SYSCALL_ERRNO (ret) : 0;
Alternatively, start udb with the --args
command-line option to specify the program and its command-line arguments:
$ udb --args examples/hashtable 12345
Reading symbols from examples/hashtable...
Then use the run command in UDB to run the program with the arguments already given:
not running> run
Starting program: examples/hashtable 12345
hashtable: hashtable.c:131: main: Assertion `table_contains(table, element)' failed.

Program received signal SIGABRT, Aborted.
__pthread_kill_implementation (no_tid=0, signo=6, threadid=<optimized out>)
    at ./nptl/pthread_kill.c:44
44            return INTERNAL_SYSCALL_ERROR_P (ret) ? INTERNAL_SYSCALL_ERRNO (ret) : 0;
See Invoking UDB for more details.
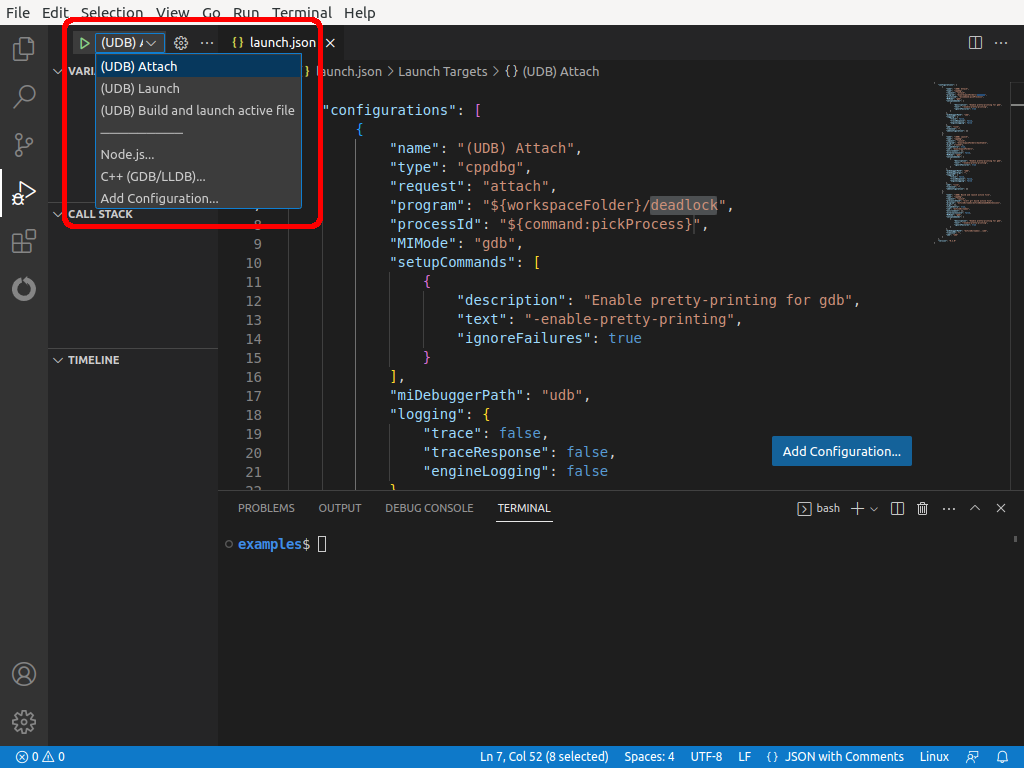
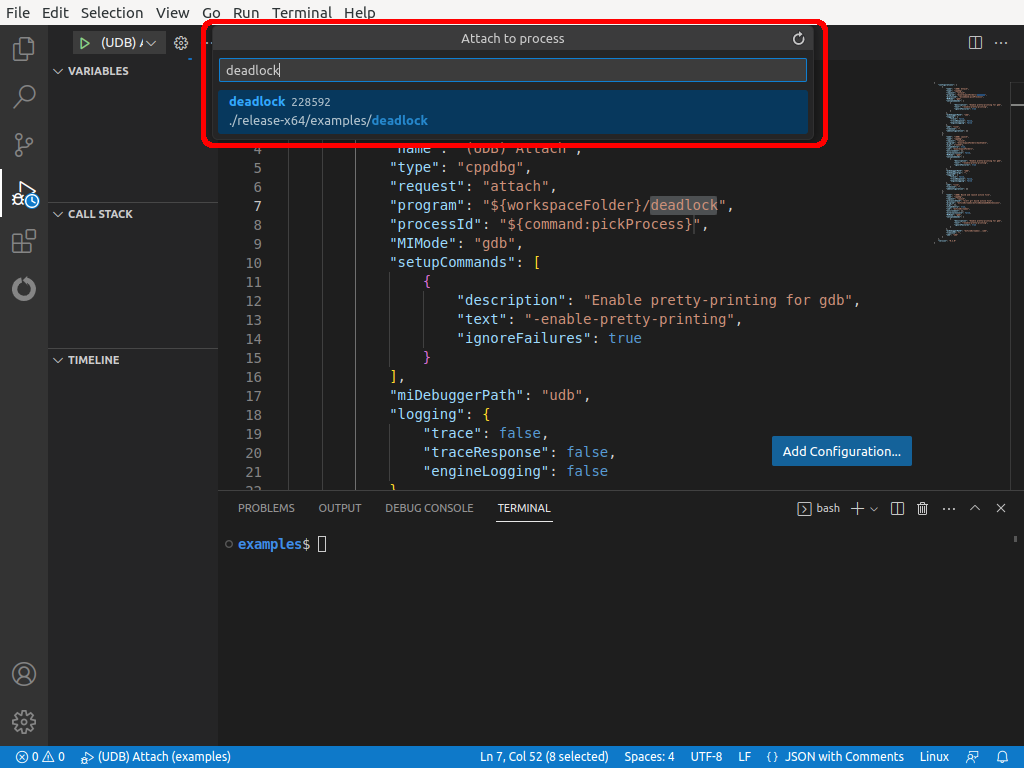
Attaching to an existing process
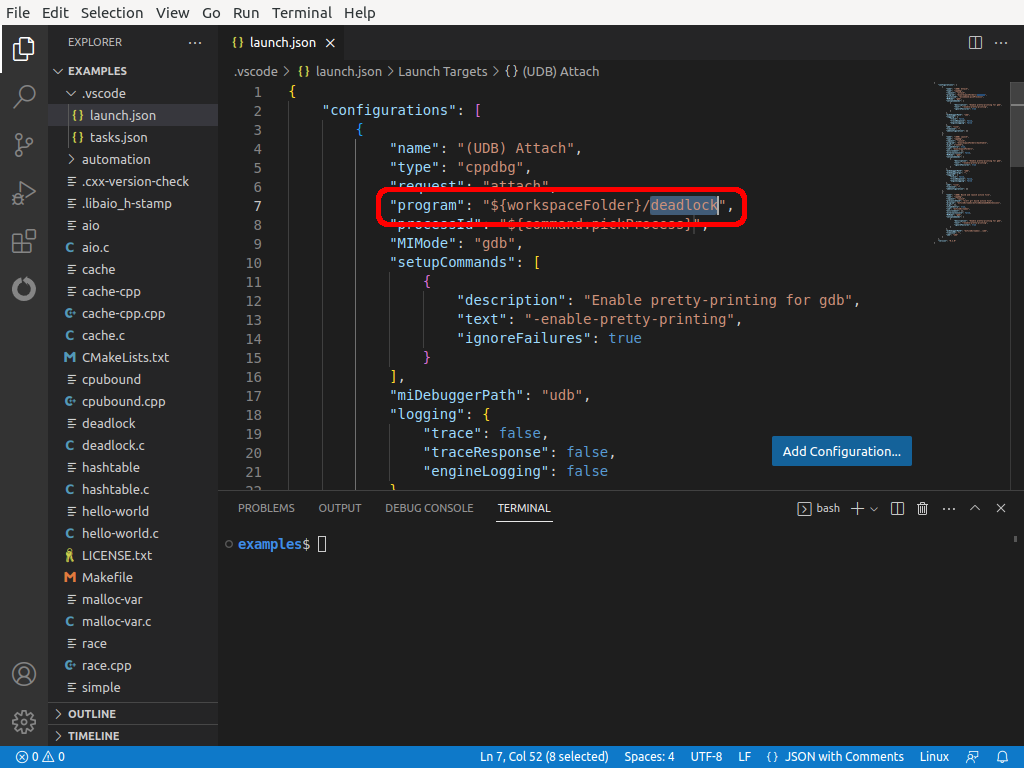
Attach UDB to a running process using the udb --pid PID command-line option. For example:
$ examples/deadlock &
Running as pid 233
$ udb --pid 233
Reading symbols from /lib/x86_64-linux-gnu/libc.so.6...
Reading symbols from /lib64/ld-linux-x86-64.so.2...
Have reached start of recorded history.
0x00007ffff7e40d6f in __futex_abstimed_wait_common64 (private=128, cancel=true, abstime=0x0,
    op=265, expected=239, futex_word=0x7ffff7da4990) at ./nptl/futex-internal.c:57
57          return INTERNAL_SYSCALL_CANCEL (futex_time64, futex_word, op, expected,
recording 1> info threads
  Id   Target Id                 Frame
* 1    Thread 233.233 "deadlock" 0x00007ffff7e40d6f in __futex_abstimed_wait_common64 (
    private=128, cancel=true, abstime=0x0, op=265, expected=239, futex_word=0x7ffff7da4990)
    at ./nptl/futex-internal.c:57
  2    Thread 233.239 "deadlock" futex_wait (private=0, expected=2,
    futex_word=0x555555558078 <g_lists+56>) at ../sysdeps/nptl/futex-internal.h:146
  3    Thread 233.240 "deadlock" futex_wait (private=0, expected=2,
    futex_word=0x555555558040 <g_lists>) at ../sysdeps/nptl/futex-internal.h:146

Forward and reverse execution
To execute the program forward, use the execution commands. For example, the step command executes the program forward to the next source line, and the continue command continues execution of the program until a breakpoint is hit or the program stops on a signal.
To execute the program backward, use the reverse-execution commands. For example, the reverse-step command executes the program backward to the previous source line, and the reverse-continue command executes the program backward until a breakpoint is hit, or the program stops on a signal, or it reaches the start of execution history.


Other methods of navigation
Use the ugo start or ugo end commands to jump to the beginning or end of the program’s execution history.
Use the ugo undo command to undo the last command that changed the time in execution history.
Jump to a point in the middle of the program’s execution history by jumping to a bookmark that you’ve previously created (see Bookmarks), or by jumping to a wall-clock time (see Log Jump).

