Breakpoints and watchpoints
Breakpoints
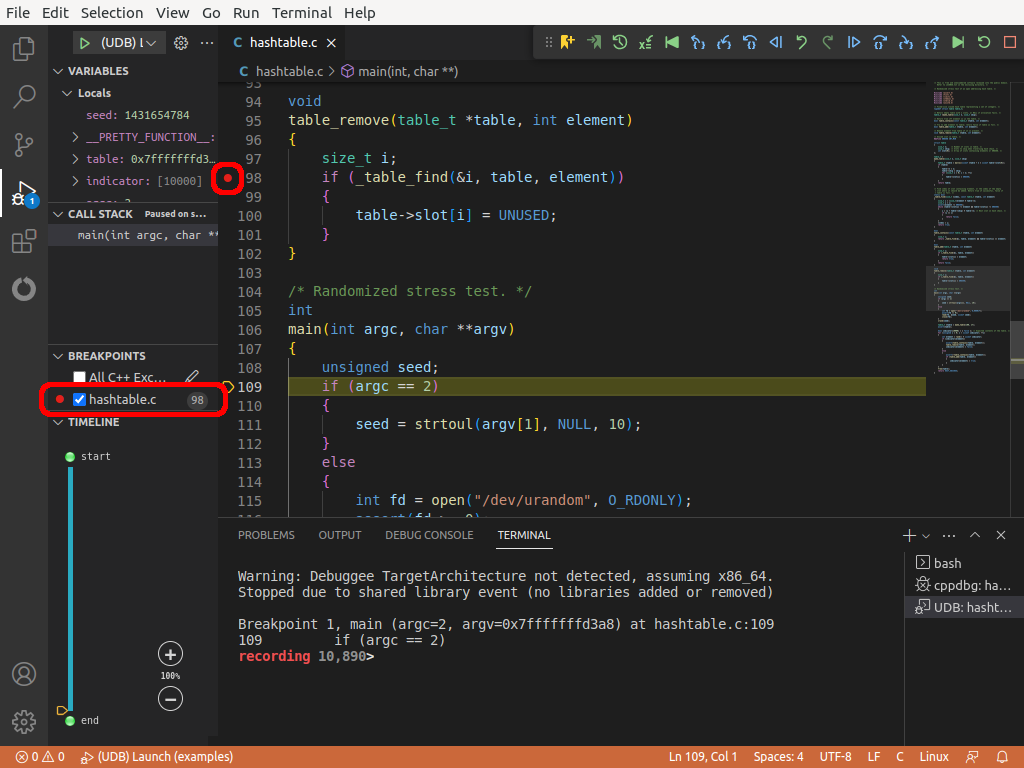
Breakpoints tell UDB to stop the execution (or reverse execution) of the program when it reaches a location.
Create breakpoints using the break and tbreak commands and delete them with the delete command. List breakpoints using the info breakpoints command.
break [location] [thread thread] [if condition]
b [location] [thread thread] [if condition]
Set a breakpoint at location, which can be one of these:
(omitted) — The next instruction in the selected stack frame.
number — The line number in the current source file.
[+|-]number — The line number relative to the current line.
filename:number — The line number in the source file.
function — The first line in the function body.
filename:function — The first line in the function in the source file.
label — The label in the selected stack frame.
function:label — The label in the function.
*address — The address of the instruction.
If location might be ambiguous, use these options to disambiguate:
- -line [+|-]NUMBER
- -source FILENAME
- -function FUNCTION
- -label LABEL
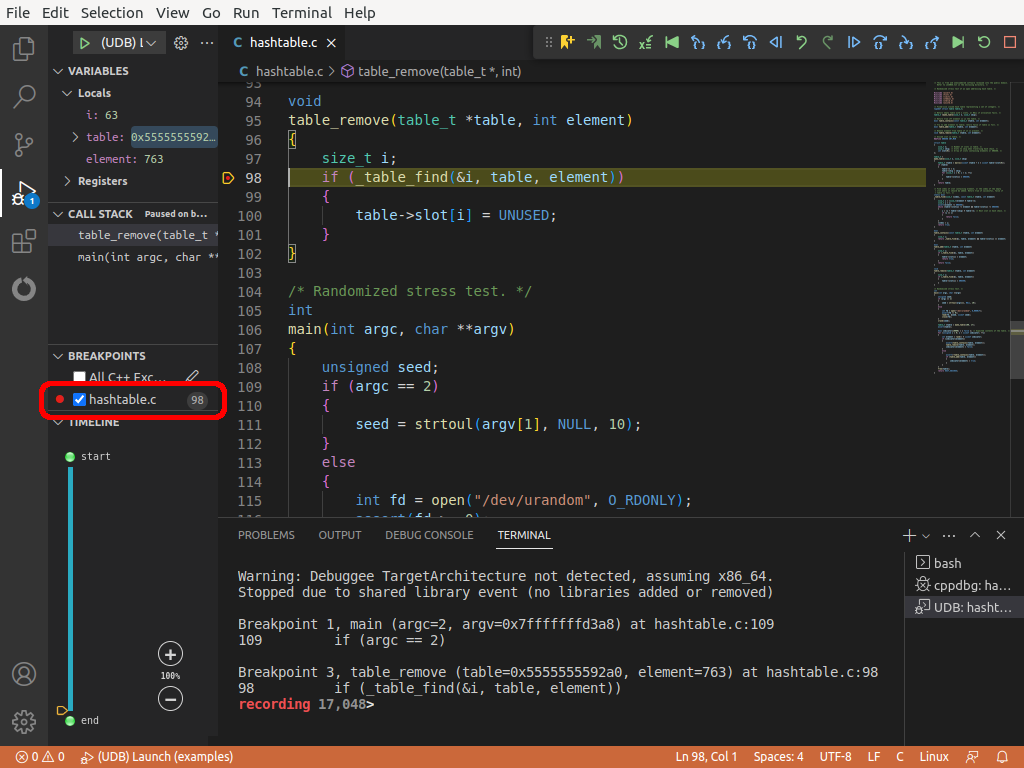
UDB stops the program when it reaches the location specified by the breakpoint and returns control to the debugger. For example:
$ udb --args examples/hashtable 12347
Reading symbols from examples/hashtable...
not running> run
Starting program: examples/hashtable 12347
hashtable: hashtable.c:131: main: Assertion `table_contains(table, element)' failed.

Program received signal SIGABRT, Aborted.
__pthread_kill_implementation (no_tid=0, signo=6, threadid=<optimized out>)
    at ./nptl/pthread_kill.c:44
44            return INTERNAL_SYSCALL_ERROR_P (ret) ? INTERNAL_SYSCALL_ERRNO (ret) : 0;
recording 2,009,793> break table_remove
Breakpoint 1 at 0x555555555471: file hashtable.c, line 98.
recording 2,009,793> reverse-continue
Continuing.

Breakpoint 1, table_remove (table=0x5555555592a0, element=5219) at hashtable.c:98
98          if (_table_find(&i, table, element))
99% 2,007,345> backtrace
#0  table_remove (table=0x5555555592a0, element=5219) at hashtable.c:98
#1  0x000055555555566c in main (argc=2, argv=0x7fffffffec78) at hashtable.c:132
To stop the program only in a specific thread, append “thread thread” where thread is the thread number, for example from the
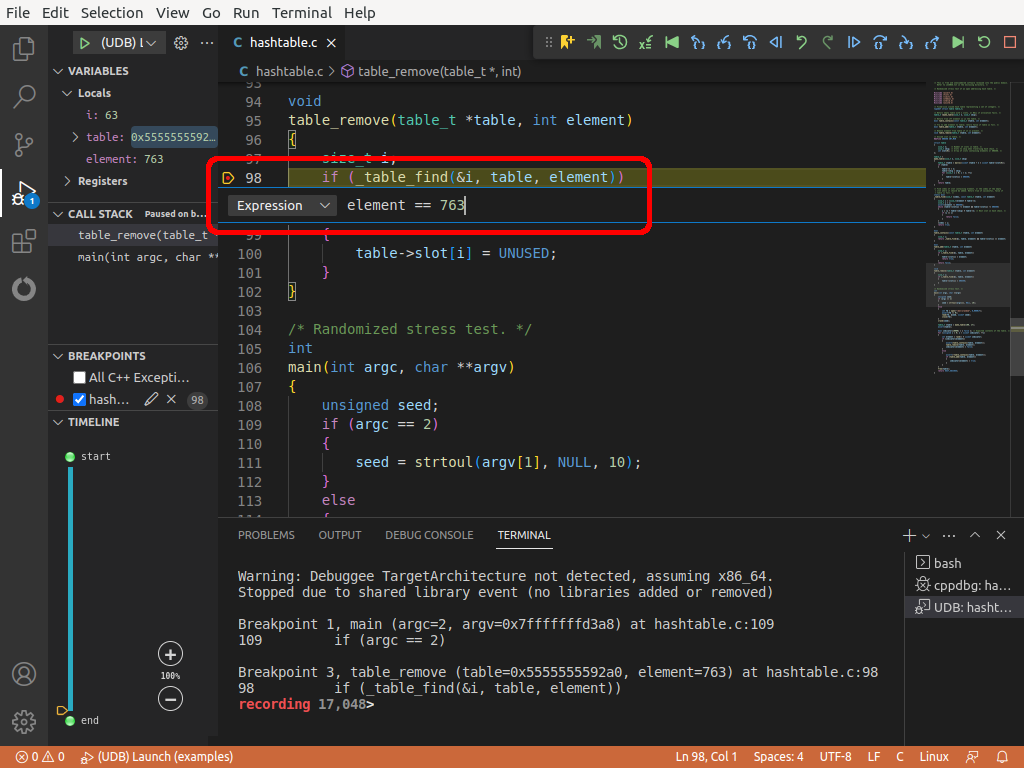
info threadscommand.To stop the program at a breakpoint only if variables have particular values, append “if condition”. The condition must an expression in the programming language of the program being debugged. The condition is evaluated each time the breakpoint is hit, and the program is stopped if the condition is true. For example:
99% 2,007,345> print element
$1 = 5219
99% 2,007,345> break table_add if element == 5219
Breakpoint 2 at 0x555555555424: file hashtable.c, line 86.
99% 2,007,345> reverse-continue
Continuing.

Breakpoint 2, table_add (table=0x5555555592a0, element=5219) at hashtable.c:86
86          if (_table_find(&i, table, element))
0% 8,196> backtrace
#0  table_add (table=0x5555555592a0, element=5219) at hashtable.c:86
#1  0x00005555555556cc in main (argc=2, argv=0x7fffffffec78) at hashtable.c:138
Add a condition to a breakpoint, or change the condition, using the condition command.
commands [breakpoint1 [breakpoint2 …]]
Set up UDB commands to be run automatically when any of the specified breakpoints is hit. With no arguments, set up commands for the most recently created breakpoint.
Enter the commands one per line, followed by “end”. For example, to stop in a function and automatically reverse-finish to the caller, use:
0% 8,196> break malloc
Breakpoint 3 at 0x7ffff7e55650: malloc. (47 locations)
0% 8,196> commands 3
Type commands for breakpoint(s) 3, one per line.
End with a line saying just "end".
>reverse-finish
>end
condition breakpoint [condition]
Add or change the condition on breakpoint. See the break command for details. Specify the breakpoint by its number, for example from the info breakpoints command.
With no condition argument, remove the condition from breakpoint.
delete [breakpoint1 [breakpoint2 …]]
d [breakpoint1 [breakpoint2 …]]
Delete the specified breakpoints, or all breakpoints if no arguments are given.
info breakpoints [breakpoint1 breakpoint2 …]
info b [breakpoint1 breakpoint2 …]
Describe the specified breakpoints, or all breakpoints if no arguments are given. The columns in the table are:
Num: The breakpoint number.
Type: “breakpoint” or “watchpoint”.
Disp: “keep” if the breakpoint will be retained when it is hit; “del” if it will be deleted.
Enb: “y” if the breakpoint is enabled; “n” if it is disabled.
Address: The address of the instruction where the program will stop.
What: Location of the breakpoint in the source code.
For example:
0% 8,196> info breakpoints
Num     Type           Disp Enb Address            What
1       breakpoint     keep n   0x0000555555555471 in table_remove at hashtable.c:98
        breakpoint already hit 1 time
2       breakpoint     keep y   0x0000555555555424 in table_add at hashtable.c:86
        stop only if element == 5219 (target evals)
        breakpoint already hit 1 time
3       breakpoint     keep y   <MULTIPLE>
        reverse-finish
3.1                         y   0x00007ffff7e55650 in __GI___libc_malloc at ./malloc/malloc.c:3294
3.2                         y   0x00007ffff7fc6dff in malloc at ../include/rtld-malloc.h:56
3.3                         y   0x00007ffff7fc7c31 in malloc at ../include/rtld-malloc.h:56
3.4                         y   0x00007ffff7fc819a in malloc at ../include/rtld-malloc.h:56
3.5                         y   0x00007ffff7fc8300 in malloc at ../include/rtld-malloc.h:56
3.6                         y   0x00007ffff7fc8c20 in malloc at ../include/rtld-malloc.h:56
tbreak [location] [thread thread] [if condition]
Set a temporary breakpoint: that is, a breakpoint that is automatically deleted when it is hit. The command takes the same arguments as the break command.
Watchpoints
Watchpoints (also known as “data breakpoints”) stop the program when the value of an expression or the contents of a memory location changes.
See “When did an expression last change value?” for a way to jump the to the next or previous time in execution history when the value of an expression changes: this is more convenient in the common case when you only want to track changes to a single expression.
Create a watchpoint using the watch command.
watch [-l|-location] expression [thread thread]
Set a watchpoint that stops the program when expression changes.
The expression is in the programming language of the program being debugged. It may be a variable:
0% 8,196> watch element
Hardware watchpoint 4: element
It may be an address prefixed with
*:0% 8,196> print table $2 = (table_t *) 0x5555555592a0 0% 8,196> watch *table Hardware watchpoint 5: *tableThis stops the program when the memory pointed to by the address changes. The size of the watched memory region is deduced from the type of the address: use a cast to change the size.
0% 8,196> watch *(char *)table
Hardware watchpoint 6: *(char *)table
- -location, -l
Remember the location in memory of expression and continue to watch that memory after any variables in expression have changed value or gone out of scope. (Without this option, a watchpoint only applies when the variables in expression are in scope, and uses their current values, not the values when the watch command was executed.)
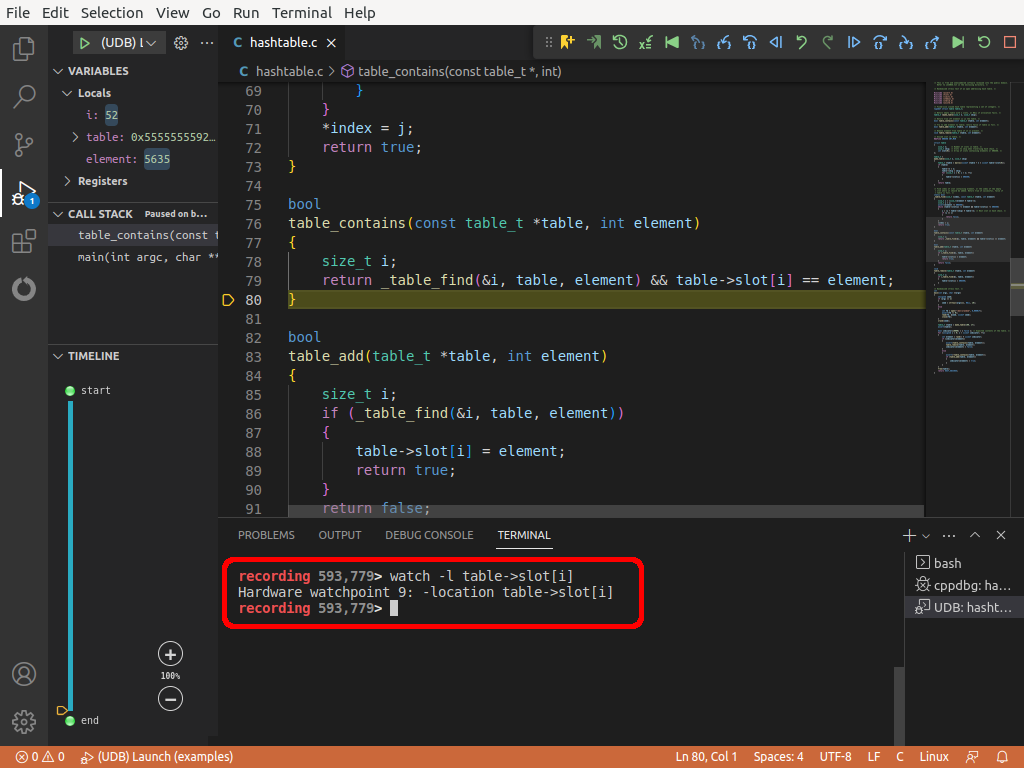
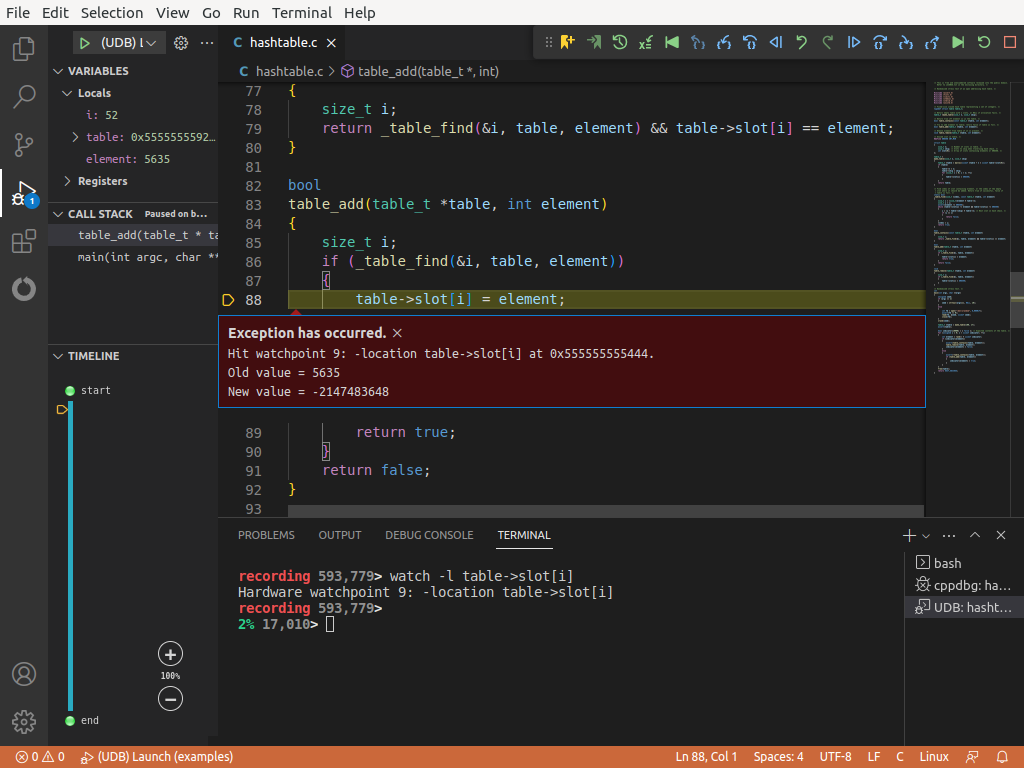
0% 8,196> watch -l table->slot[i]
Hardware watchpoint 7: -location table->slot[i]
This takes the address of table->slot[i] and continues to watch the contents of that address after the variables
tableandihave changed or gone out of scope.When a watchpoint is hit, UDB reports the previous and current values of the watched expression or location. For example:
0% 8,196> reverse-continue
Continuing.

Hardware watchpoint 7: -location table->slot[i]

Was = -2147483648
Now = 0
0x00005555555552c9 in make_table (n=100, skip=17) at hashtable.c:48
48                  table->slot[i] = UNUSED;
Warning
A watchpoint is implemented using a “hardware watchpoint” (meaning a subset of the CPU’s debug registers) if possible. To use a hardware watchpoint, the watched expression must be simple; and, since there are a limited number of debug registers, there must not be too many watchpoints.
If these conditions are not met, a “software watchpoint” is used instead. This requires re-evaluating the expression after every statement in the program, which means that the program runs much more slowly. The performance is particularly bad for reverse-execution commands, so UDB issues the following warning:
There are one or more software watchpoints, which may make reverse operations extremely slow. To avoid creating such software watchpoints, you should avoid watching registers, avoid watching $<n> convenience variables, and avoid setting too many watchpoints.
If this warning appears, try simplifying the expressions so that they can be implemented using hardware watchpoints, reducing the number of watchpoints, or using the last command instead.