Note
This feature is experimental and may change or be removed in the future.
CLion
CLion is a C/C++ IDE from JetBrains, available from the JetBrains website.
Undo supplies a plugin which integrates UDB into CLion, allowing you to interactively debug an application from within the CLion IDE.
Enabling UDB within CLion
Configure CLion to use UDB.
Choose File › Settings… › Build, Execution, Deployment › Toolchains.
Under Debugger choose Custom GDB executable.
If you have previously installed UDB, enter
/usr/local/bin/udbin the text box. Otherwise, use the Browse button and navigate to the location of the udb executable.When CLion recognizes the pathname, a message will appear, e.g. “✓ Version: 10.2”.
Install the plugin.
Choose File › Settings… › Plugins.
Select the Marketplace tab, enter
udbin the search box, press Install and restart CLion.
Using UDB within CLion
Time travel debug buttons
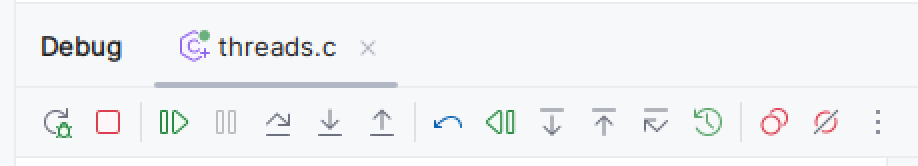
Starting a debug session works exactly as normal with CLion. However the debugger toolbar has some new buttons (from left to right in image):
Undo Last Navigation
Resume Back
Reverse Step Out
Reverse Step Into
Reverse Step Over
Log Jump
Forward and reverse execution
The plugin adds the Reverse Step Out, Reverse Step Into and Reverse Step Over buttons, which you can use to step the application backwards, and the Resume Back button to run your application backwards until it hits a breakpoint or watchpoint.
Other methods of navigation
Use the Undo Last Navigation button to undo the effects of the last button that changed the time in your application’s execution history.
If you are familiar with other UDB commands, they can be entered at the Debug GDB tab.
Log Jump
Use the Log Jump panel to navigate to a time in your application’s execution history.

Timestamp
Use the Timestamp field to navigate to a wallclock time in your application’s execution history. This is useful when you’ve identified a line of interest in a log file: in this case copy the wall-clock time from the log file and paste it into the Log Jump dialog to jump directly to the point in time in your application’s execution history where it emitted that log line.
Timestamps should ideally have millisecond accuracy but even these are only approximate so you might find that the resulting stack is just somewhere in the code that emitted the log line.
See Using wall-clock times for more details on the timestamp format.
Bbcount
A bbcount takes you to a precise point in the execution history. See ugo time for more details.
Bookmarks
The plugin allows you to set bookmarks in a recording to which you can later return. They are displayed in the TimeTravelBookmarks tool window (View › Tool Windows › TimeTravelBookmarks) as shown below:
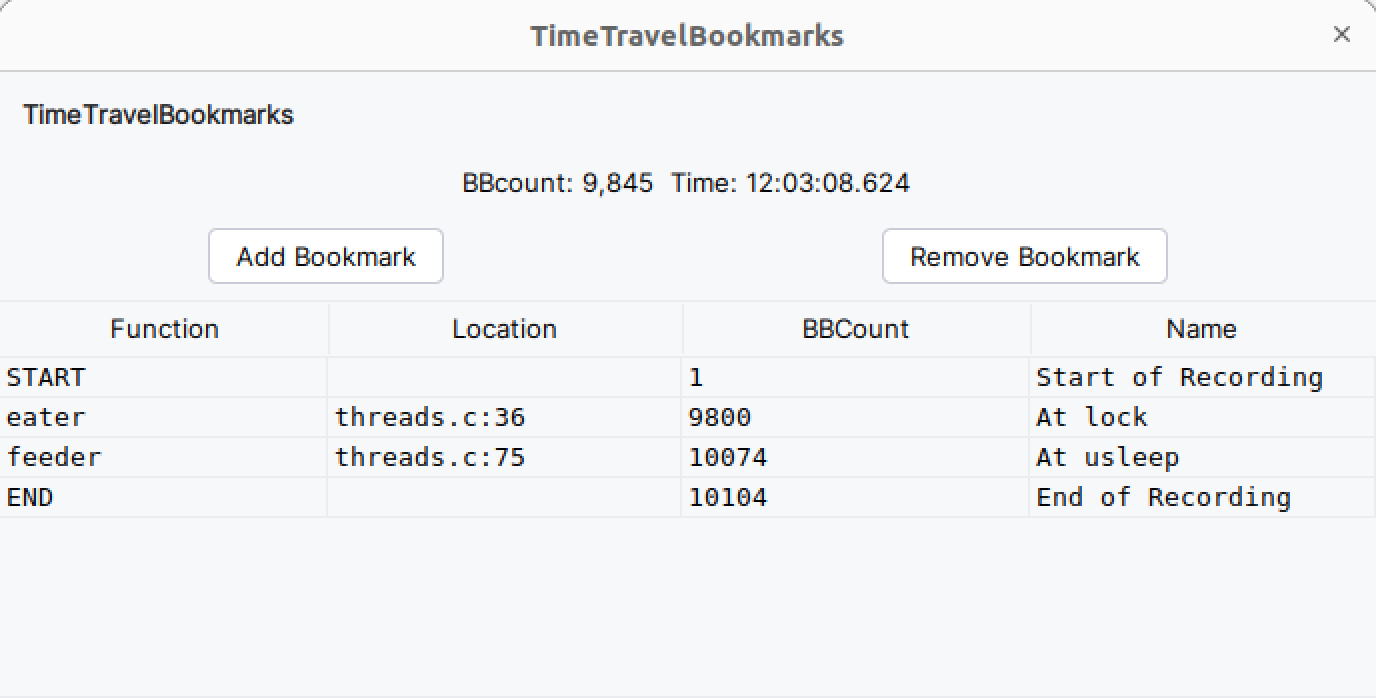
Use the START and END bookmarks to jump to the beginning or end of your application’s execution history.
Use the Add Bookmark button to add a bookmark at the current point in time in your application’s execution history. You can return to this point in time by clicking on the bookmark.
Bookmarks are automatically ordered by their place in the execution history and display the function name and location as well as the bbcount. There is also a user-editable name field to the right where you may enter text describing the bookmark.
Bookmarks are not persistent and only exist for the lifetime of the session.
If you press the control key and hover over a cell content or over the bbcount or time at the top, the value will be copied to the clipboard.
Loading an Undo recording with CLion
CLion can also be used to replay an Undo recording, by following this procedure:
Configure CLion to use UDB, by following the procedure under Enabling UDB within CLion.
Create a “Core Dump Debug” run configuration, by selecting Run/Debug Configuration and then Core Dump Debug.
In the Debugger field, select udb.
In the Core Dump chooser, select the desired Undo recording.
Proceed to debug as if this were a live executable.
Using a Docker toolchain
A Docker toolchain can be used to run either a live debug session or to replay a recording.
Follow the instructions on the JetBrains website to set up the docker toolchain. Add the following to the dockerfile:
RUN mkdir -p /.local/share
RUN chmod -R 0777 /.local
RUN mkdir /.cache
RUN chmod 0777 /.cache
ADD undo-7.1.1.tgz /
where
undo-7.1.1.tgzshould be replaced by the name of your distribution download.Configure CLion to use UDB in the docker toolchain.
Choose File › Settings… › Build, Execution, Deployment › Toolchains.
Click
+ (Add)and choose Docker (if not already present)Under Debugger choose Custom GDB executable.
Enter
/undo-7.1.1/udbin the text box (whereundo-7.1.1should be the top level directory of the unzipped distribution)Note: you must make the docker toolchain the default (if it is not already) by clicking on the Up button. Failure to do so can result in the message “is not a core dump: file format not recognized”.
Configure CLion to replay a recording
If you wish to replay a recording you can set the volume binding under the Toolchains setting so that the recording file on the host machine is viewable by the docker container.
Under Container Settings add a Volume binding and make the directory where the recording is stored visible to the docker container. The directory name must be the same on both sides.
The recording file can now be replayed as described in Loading an Undo recording with CLion with the exception that in the Debugger field you should select udb from ‘Docker’ toolchain.