Time travel debugging in IntelliJ
Setup
If you’re replaying a recording, use the lr4j_replay tool.
Or if you’re debugging remotely, launch your application on the remote machine supplying the Undo for Java agents on the Java command-line.
Consider adding breakpoints and/or watchpoints before starting the debugger session since your application or recording will start running as soon as you press the Debug button.
Start the debugger session
Choose a Run/Debug configuration from the Run/Debug Configurations dialog and press the Debug button to start debugging.
Note
Refer to Replaying a recording or Live Debugging if you haven’t already created a Run/Debug configuration.
While your application is running, you can’t interact with it or examine application state. You can only Pause, Stop or Rerun your application. See IntelliJ tips for more info.
Once your application is suspended due to hitting a breakpoint or watchpoint, you can examine variables and the contents of the stack and evaluate arbitrary expressions. Refer to the IntelliJ documentation for details. You can’t alter variables while time-travel debugging, since doing so would likely change the future execution of the application and cause the timelines to diverge.
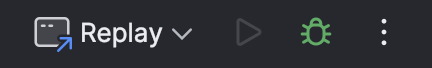
Time travel debug buttons

In addition to the familiar Resume, Step Over, Step Into, and Step Out buttons the plugin adds the following (from left to right in image):
Resume Back
Undo Last Navigation
Reverse Step Out
Reverse Step Into
Reverse Step Over
Log Jump
Step Across Back
Step Across
Forward and reverse execution
The plugin adds the Reverse Step Out, Reverse Step Into and Reverse Step Over buttons, which you can use to step the application backwards, and the Resume Back button to run your application backwards until it hits a breakpoint or watchpoint.
Other methods of navigation
Use the Undo Last Navigation button to undo the effects of the last button that changed the time in your application’s execution history.
Log Jump
Use the Log Jump panel to navigate to a time in your application’s execution history.
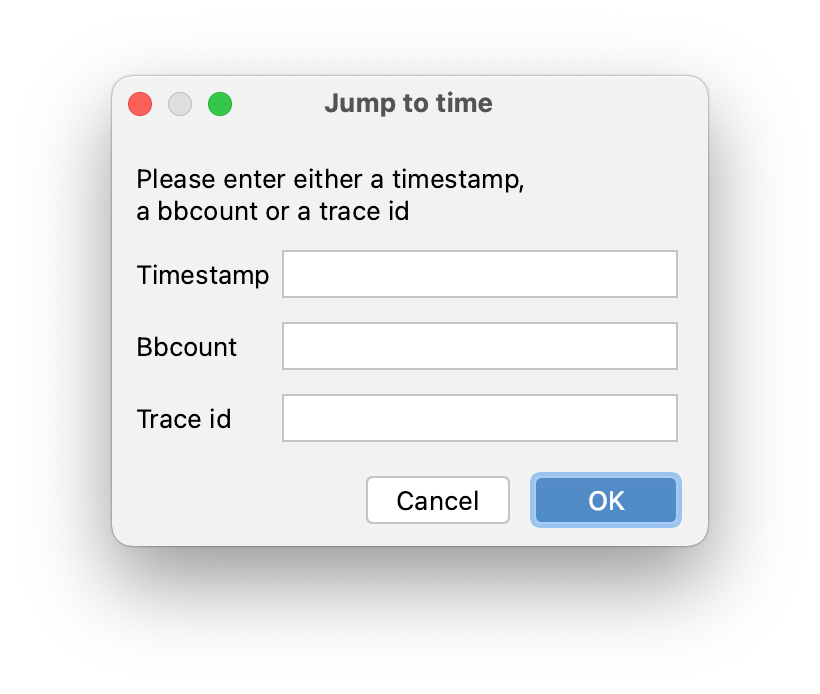
Timestamp
Use the Timestamp field to navigate to a wallclock time in your application’s execution history. This is useful when you’ve identified a line of interest in a log file: in this case copy the timestamp from the log file and paste it into the Log Jump dialog to jump directly to the point in time in your application’s execution history where it emitted that log line. (The Log Viewer window is an alternative way of doing the same thing)
Timestamps should ideally have millisecond accuracy but even these are only approximate so you might find that the resulting stack is just somewhere in the code that emitted the log line.
Note
The Log Jump feature recognizes timestamps in many standard time formats produced by common logging frameworks including Log4j, Logback and java.util.logging. You can add other time formats under Settings › Tools › Undo for Java › Timestamp patterns. If the timezone is not specified in the timestamp it defaults to the local timezone.
Bbcount
A bbcount takes you to a precise point in the execution history. You may have made a note of a bbcount at some time or you may have obtained it through looking at the recording using udb
Trace id
If you have a Span ID generated by something like OpenTelemetry then you can enter that here to go directly to the method call associated with it. This is similar to doing the second half of Step Across. You may for instance have obtained a Span ID using Zipkin.
Object id
Entering an object address will result in a search backwards through the execution history to the place where that object was created. You must start from a point where that address is current. You can use this for instance if you have an OutOfMemory error resulting in a heap dump which you have examined using Eclipse Memory Analyzer. That tool will tell you the state of the heap where the OOM occurred, but you may wish to see what created one of the objects. For this to work the starting point should be where the OOM occurred (or sometime after is usually ok, e.g. the end of the recording if you stopped soon after the OOM).
Tip
You can right-click any object in the IntelliJ debugger Variables panel and choose Copy Object ID to copy the object’s address. Paste it into the Object ID field to jump to where that object was created.
Step Across
Use the Step Across and Step Across Back buttons to step between two of the services that comprise a microservice-based application. Step Across jumps to the point in time in another service’s execution history when it received the next API call made by this service. Step Across Back jumps to the point in time in another service’s execution history when it last made an API call to this service. Step Across works with HTTP/REST, reactive clients, and Java RMI calls. Refer to Microservices for more information.
Bookmarks
The plugin allows you to set bookmarks in a recording to which you can later return. They are displayed in the TimeTravelBookmarks tool window (View › Tool Windows › TimeTravelBookmarks) as shown below:
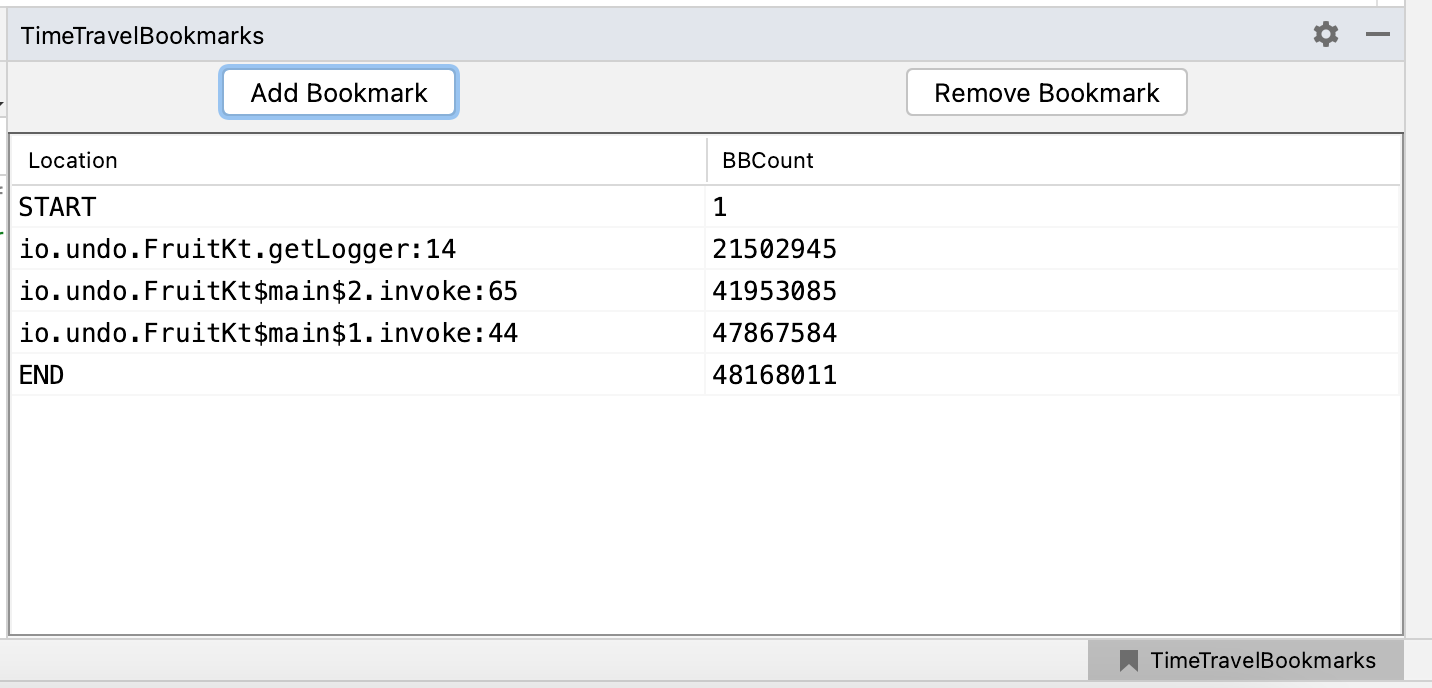
Use the START and END bookmarks to jump to the beginning or end of your application’s execution history.
Use the Add Bookmark button to add a bookmark at the current point in time in your application’s execution history. You can return to this point in time by clicking on the bookmark.
Bookmarks are automatically ordered by their place in the execution history and display the location as well as the bbcount.
Bookmarks are not persistent and only exist for the lifetime of the session.
If you press the control key and then hover over the bbcount cell, the bbcount will be copied to the clipboard. This can be useful when examining the same recording using udb.
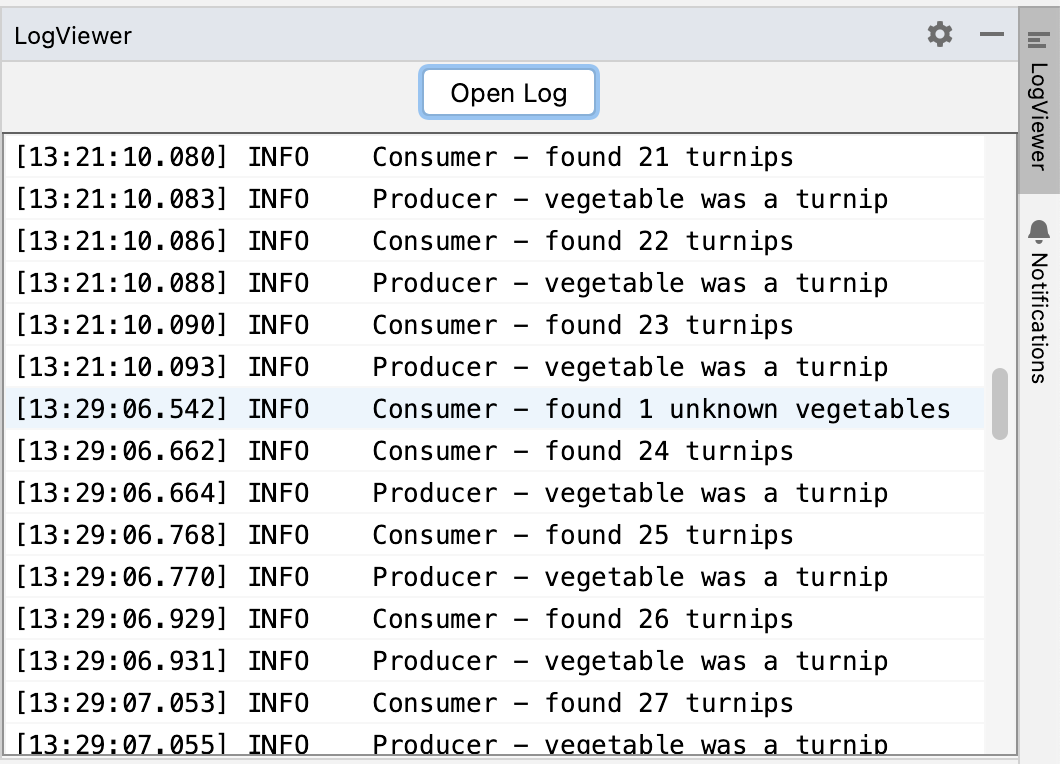
Log Viewer
As an alternative to the Log Jump window you can also open a log file in the LogViewer window (View › Tool Windows › LogViewer). If the log file contains a timestamp at the start of each line in one of the recognized formats, just clicking on that line will take you to the approximate location.